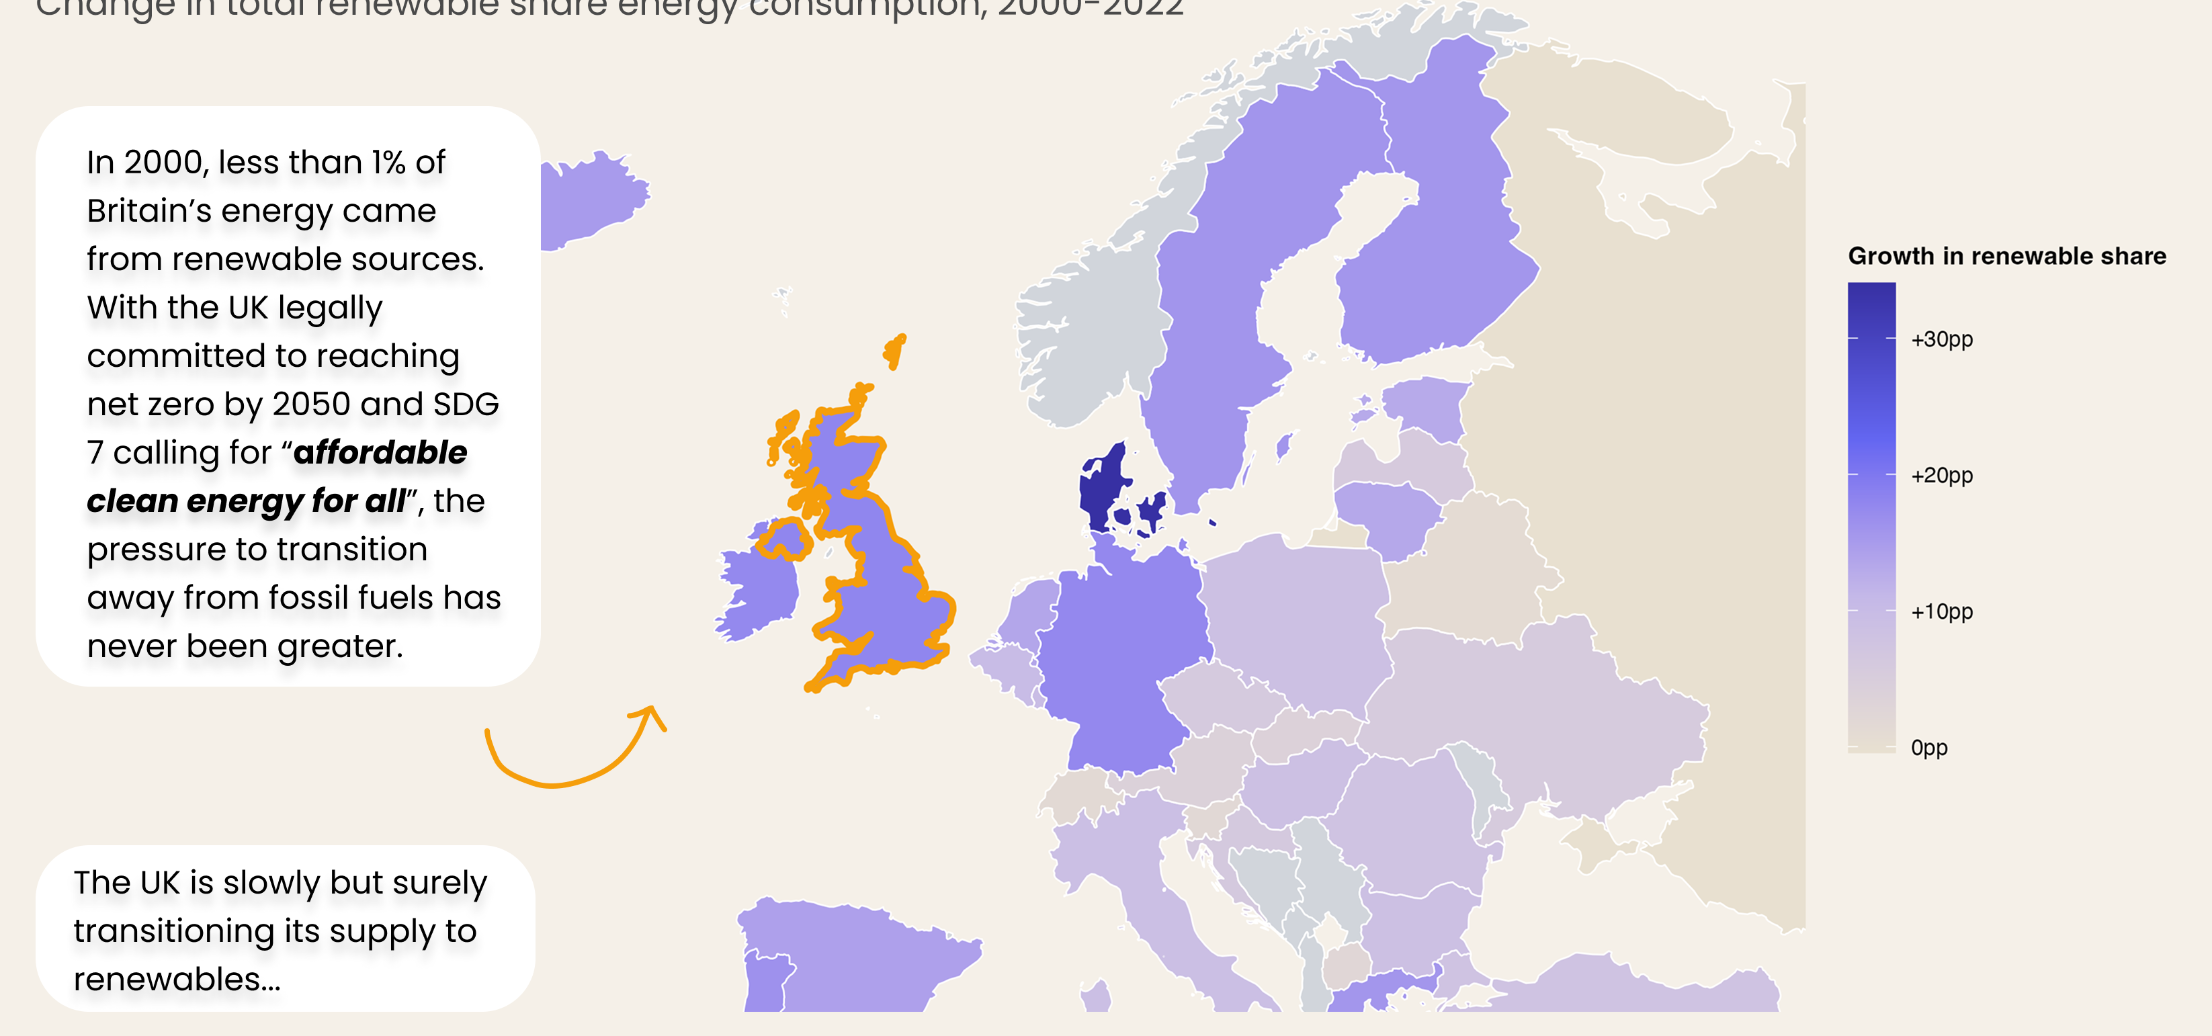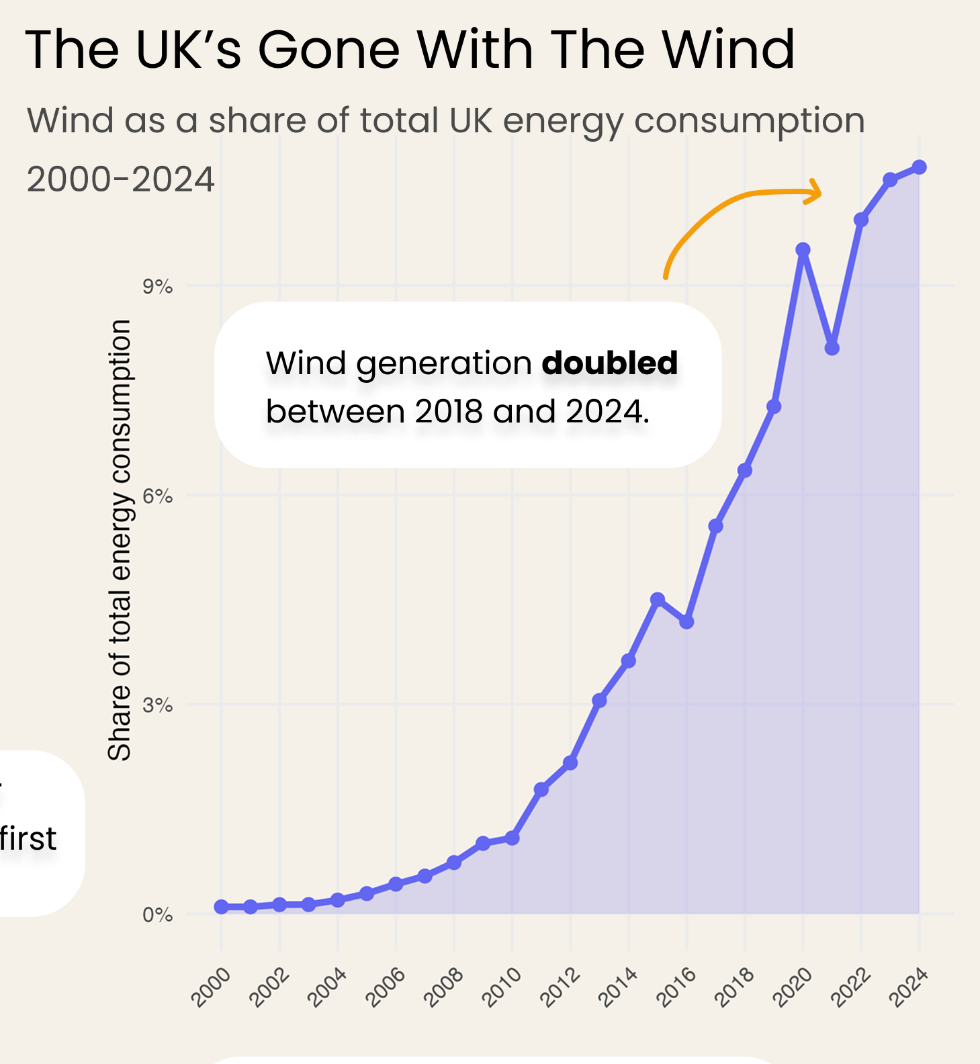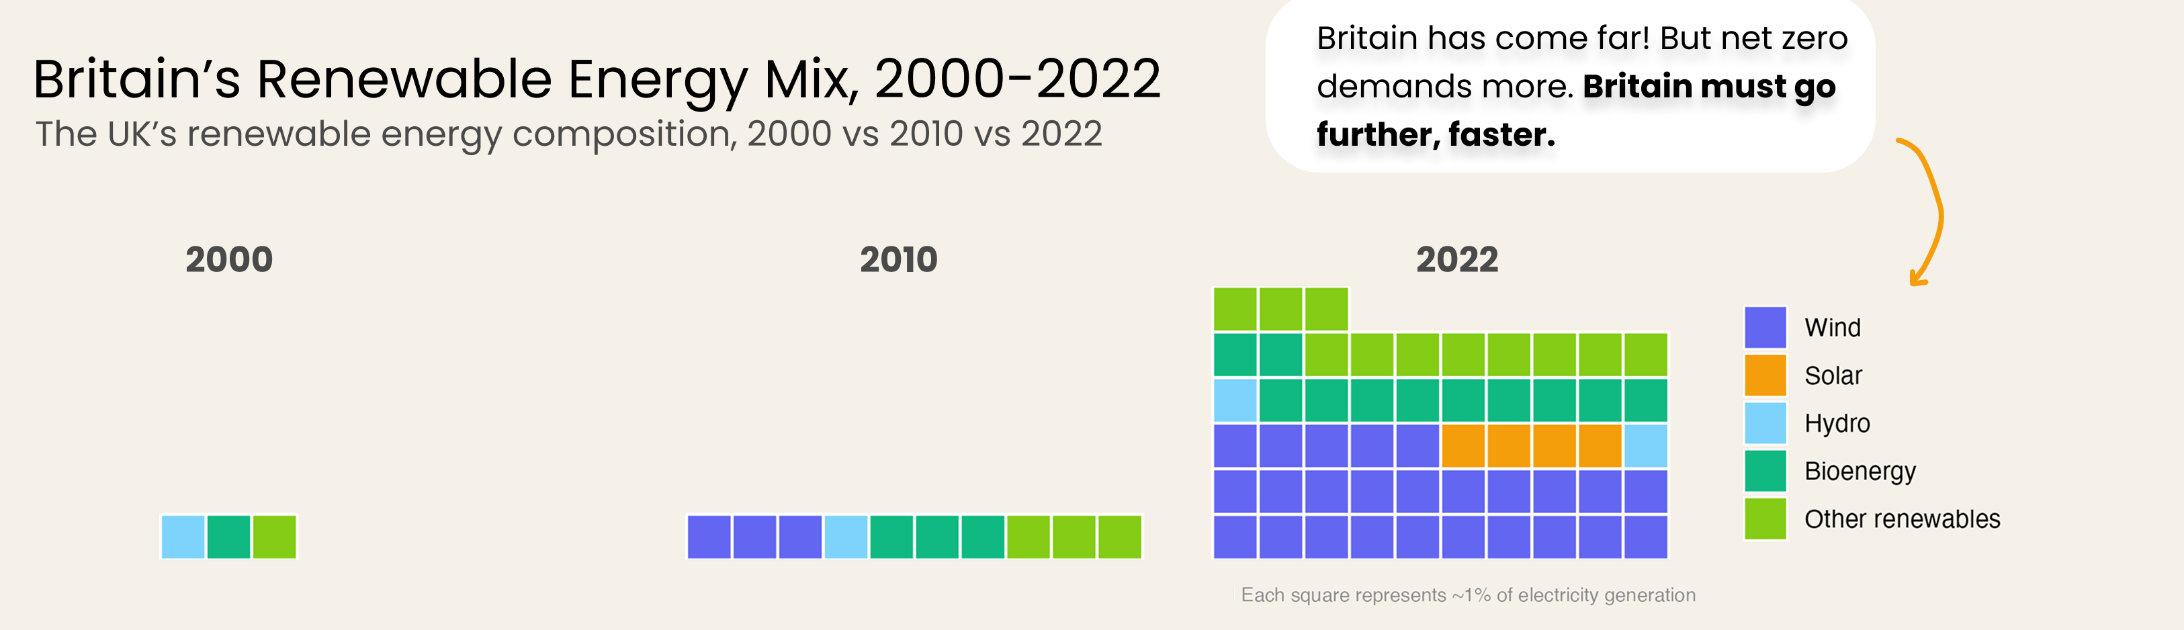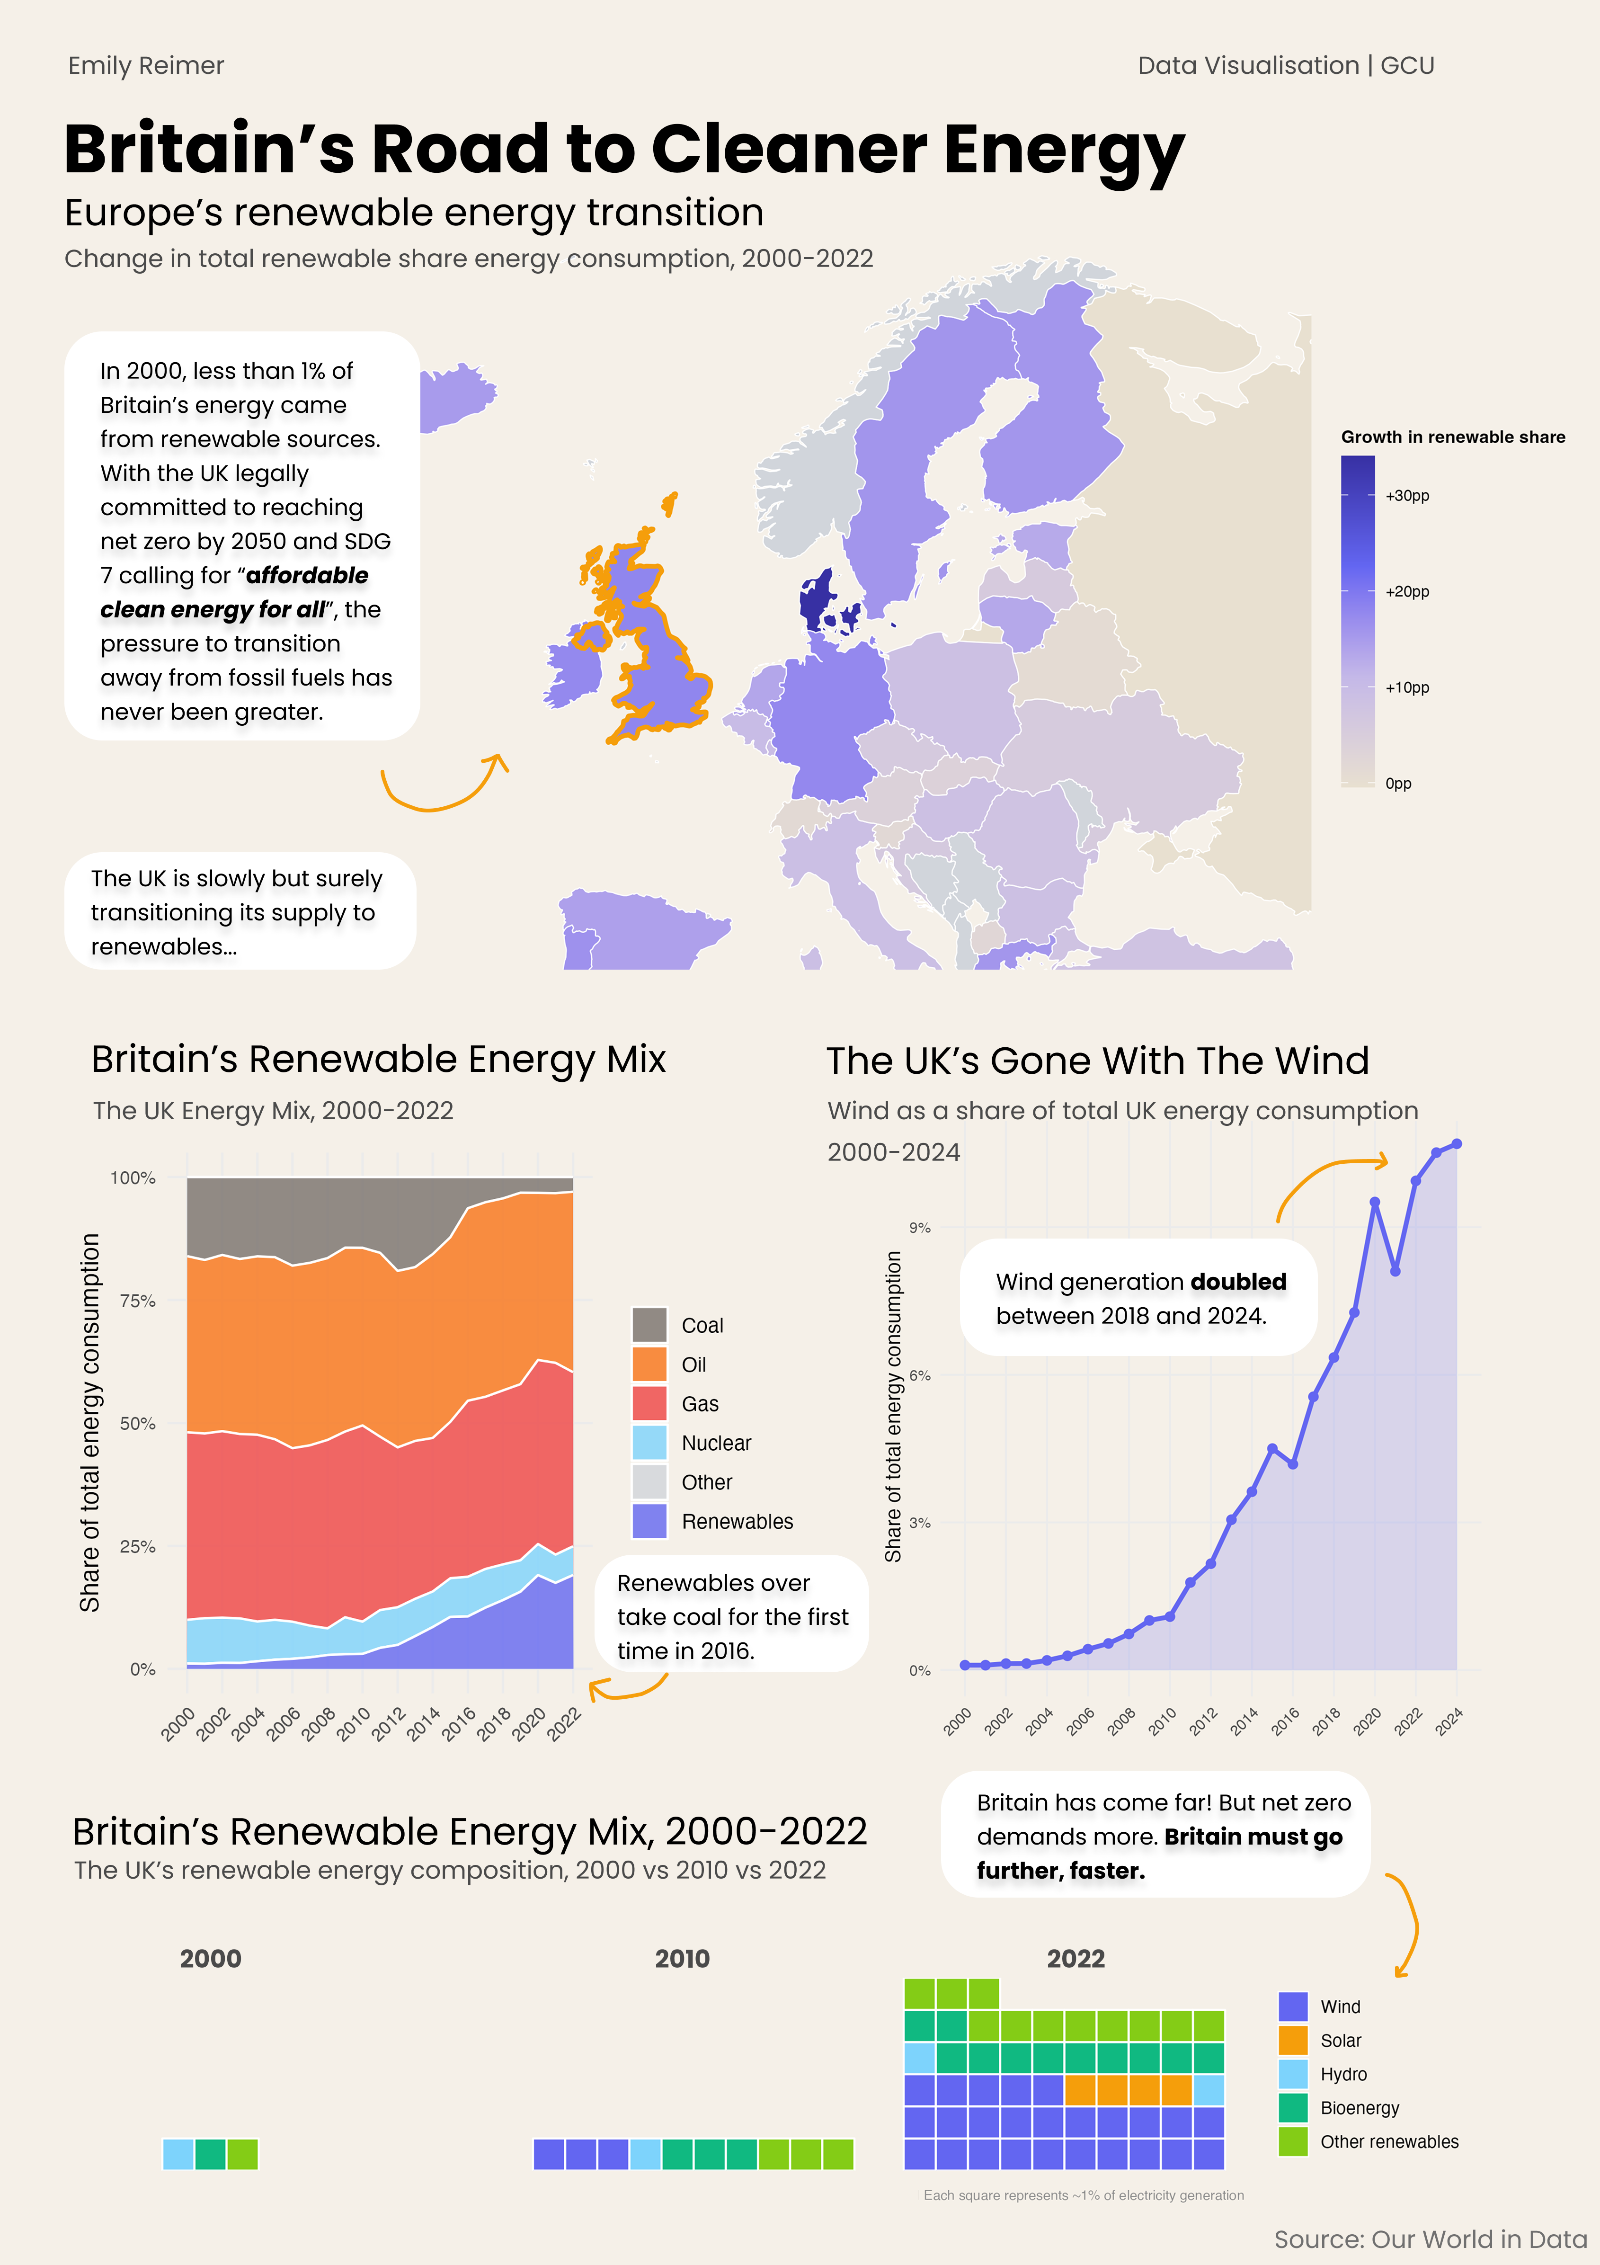
Britain’s Gone With The Wind!
Data Visualisation of Britain’s Energy Transition since 2000
Turning a data analysis of the global energy transition into a poster about Britain’s shift to wind.
Background
This project used the Our World in Data energy dataset, which covers energy consumption, production and mix for over 200 countries, alongside GDP and population. The work was framed around UN Sustainable Development Goal 7: affordable and clean energy.
I first analysed the data in R and wrote it up as a report, then reframed the research question to tell a single, clearer story on a poster.
1 / The data
Overview
- The dataset
- Exploratory analysis
The dataset
The full dataset has over 23,000 rows and 130 variables, spanning 1900 to 2022. To keep the analysis focused, I narrowed it to the years 2000 to 2022, when wind and solar began to scale, and to a handful of key variables: renewable share, fossil fuel share, energy per capita and GDP per capita.
Exploratory analysis
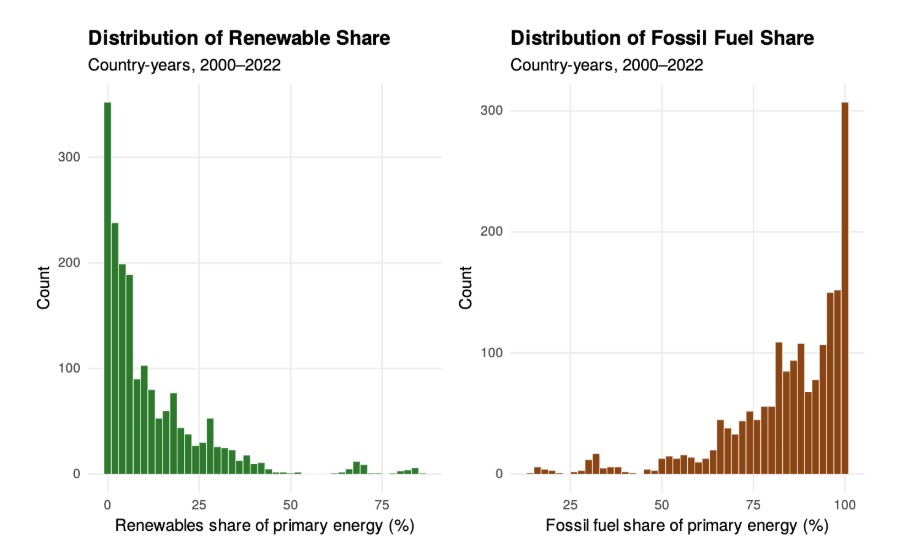
Before answering the research questions, I plotted the distribution of each variable. Renewable share was heavily skewed, with most countries close to zero, while energy and GDP per capita only revealed their shape on a log scale. This shaped the chart choices that followed.
2 / The report
Overview
- Research questions
- UK vs the world
- Wealth and energy
Research questions
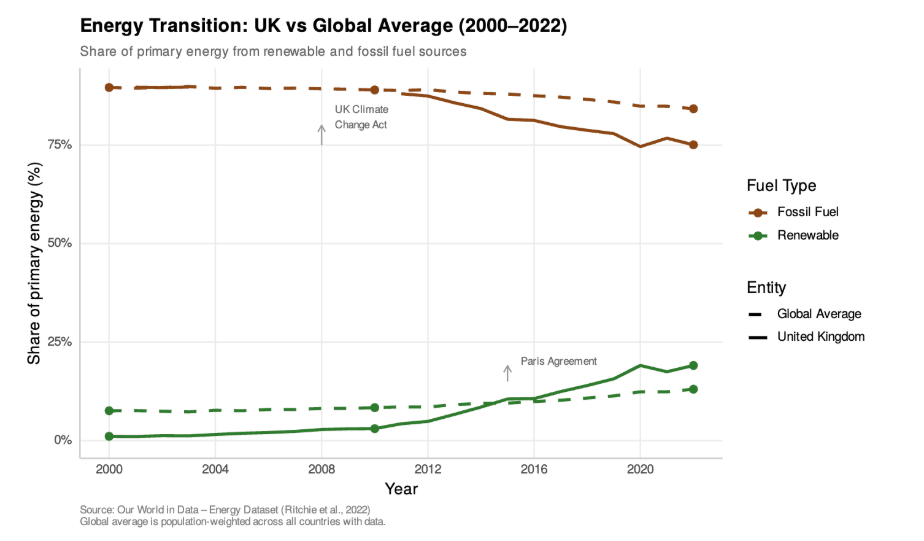
- How has the transition from fossil fuels to renewable energy progressed in the UK compared to the global average since 2000?
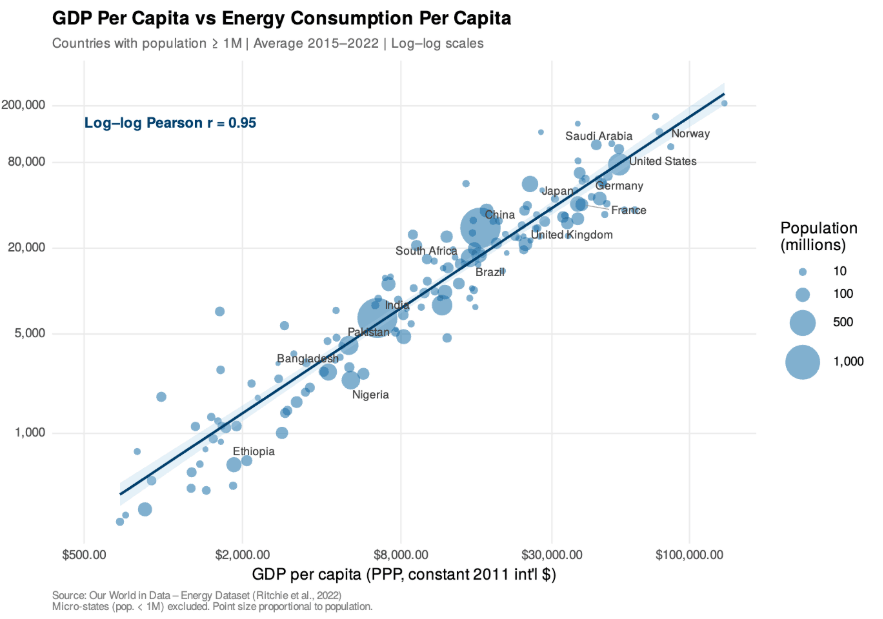
- Is there a strong relationship between a country’s GDP per capita and its energy consumption per capita?
UK vs the world
I used a multi-line time series to compare the UK with the global average, with colour for fuel type and line style for each. The UK pulled away sharply after the Climate Change Act in 2008, while the global average barely moved.
Wealth and energy
An annotated scatter plot with log scales showed a strong link between GDP and energy use per person (r ≈ 0.82), with richer countries getting more out of each unit of energy.
3 / The poster
Overview
- Final poster
- Details
Final poster
Details